Transport Accessibility and Market Potential
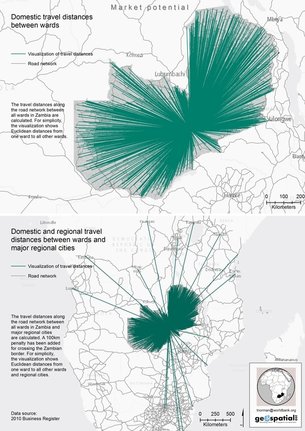
Network connections between wards/cities in and around Zambia. The links represent travel times along the road network between each location, but are displayed as straight lines for simplicity.
|
An accessibility measure is an index that shows how accessible a certain phenomenon (such as the population) is from each location. The measure is calculated by discounting the importance of surrounding places by travel time (or distance) to those surrounding places. It measures the 'market potential' of a location.
Accessibility analysis answers questions such as: "How does an improvement in the transport system impact regional development in terms of incomes and unemployment?" (Paper in my dissertation) "Is accessibility to economic activity important for the growth of highly knowledge intensive industries?" (Paper in my dissertation) "Where is the market potential (accessibility to wage-sums) highest for a retail store?" |
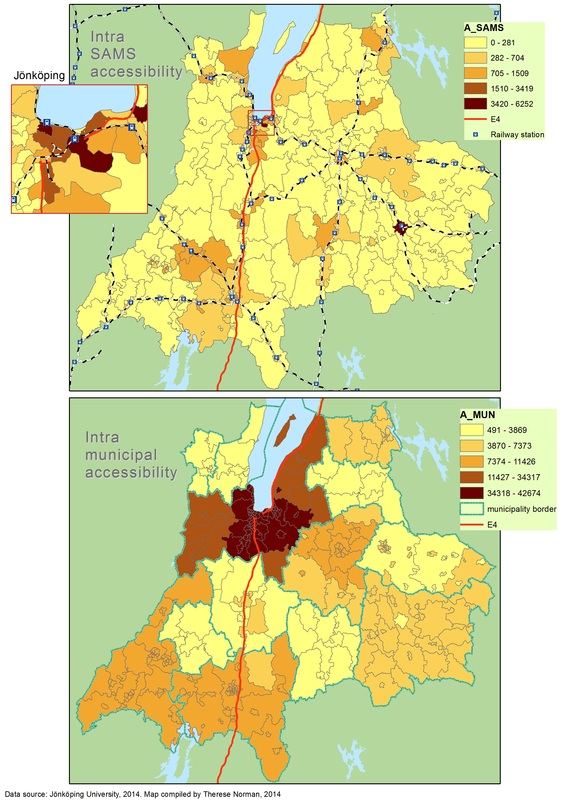
Spatial definition matters! The two maps show the difference between accessibility to economic activity within neighborhoods (top) and between neighborhoods within the same municipality (bottom) in Jönköping County, Sweden.
|
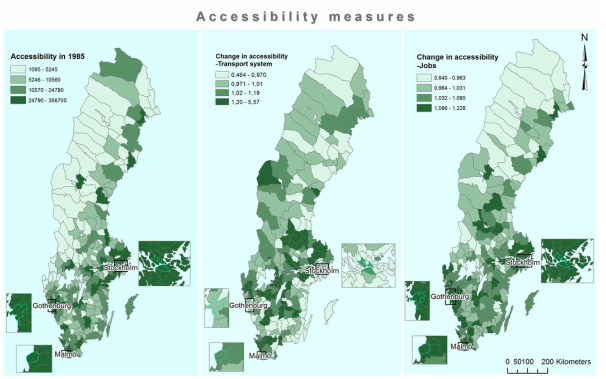
Capturing improvements in the transport system: Accessibility analysis can be used to measure changes in the transport system. The maps show accessibility to jobs (left) and change in accessibility to jobs due to changes in transport system only (middle) and due to changes in number of jobs only (right) over time in Sweden
|
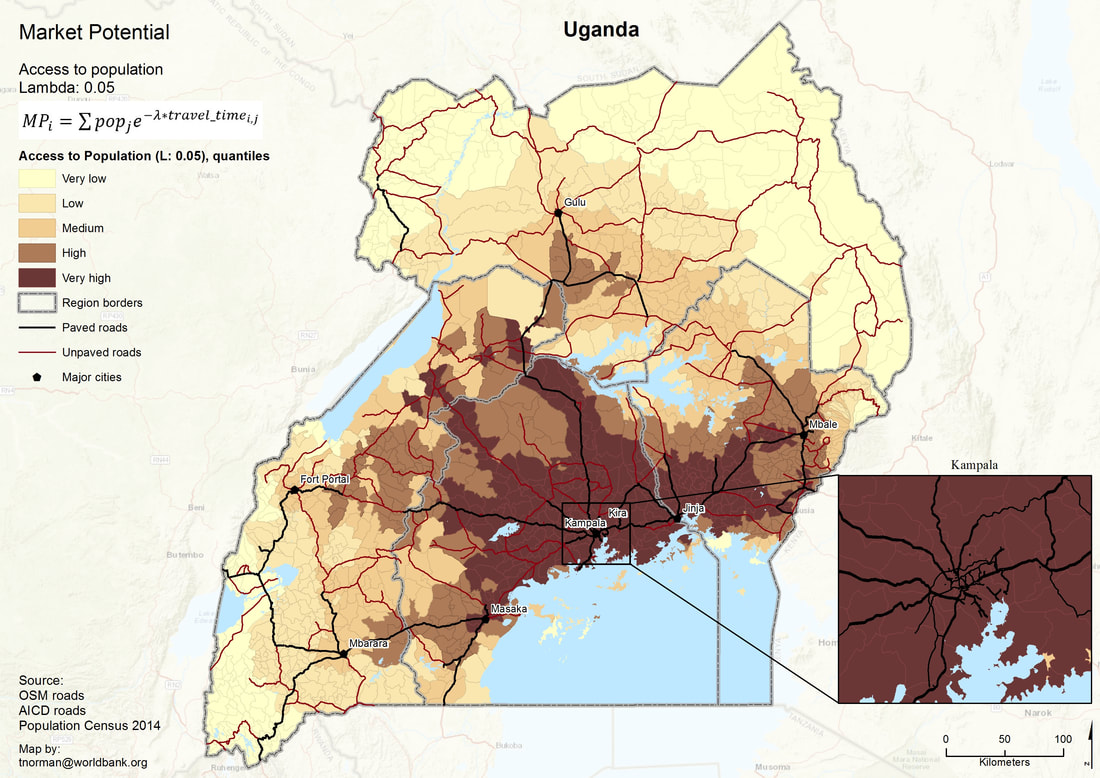
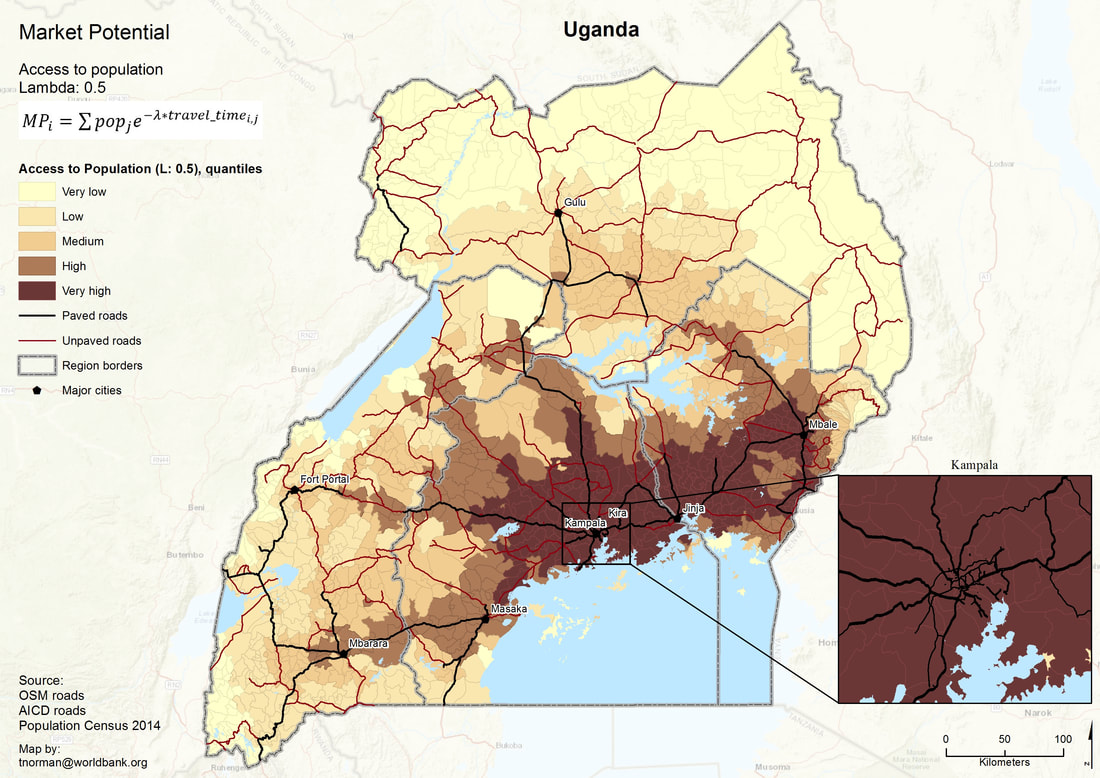
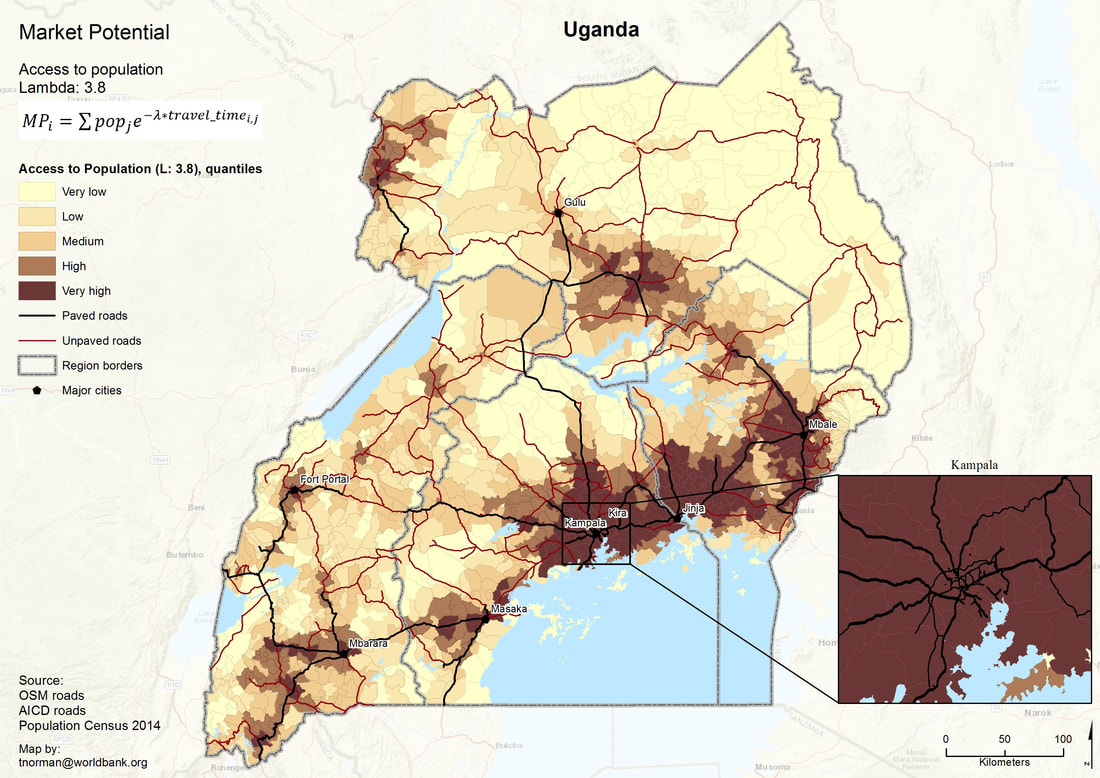
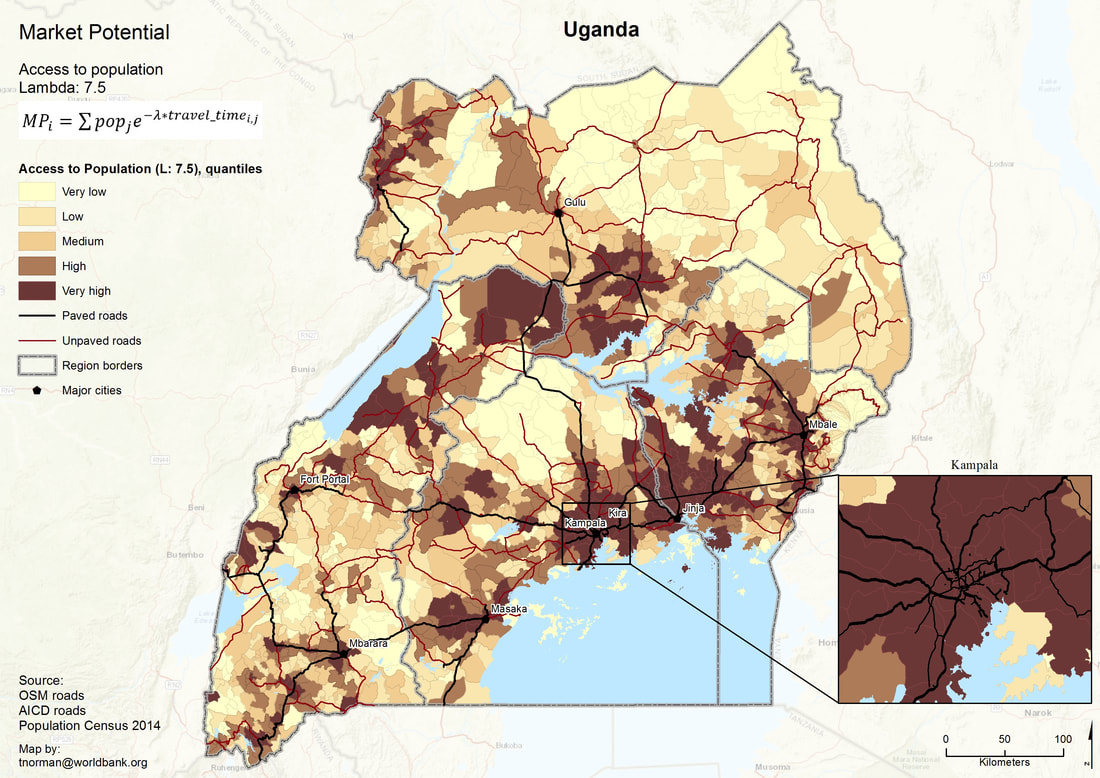
How distance is discounted matters! The four maps show the dramatic effect of using different discount factors in the accessibility to population equation.
